US elections are coming and here in Hong Kong we want to see it from an Asian perspective. Some weeks ago I start this project to collect the data of Asians in US and visualize it.
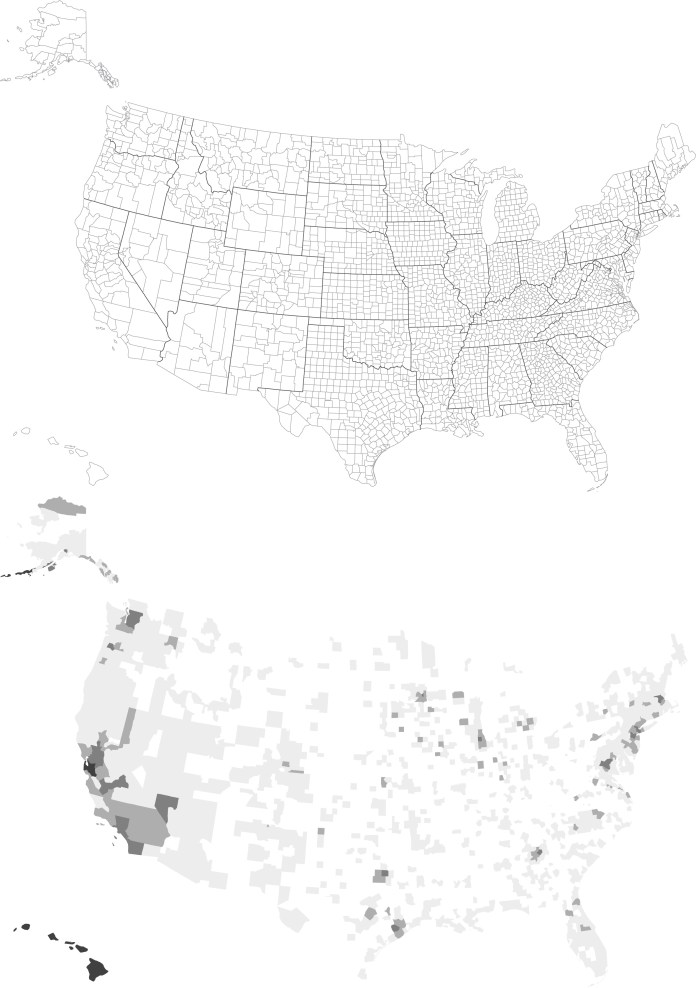
The map in first instance is nothing more than a choropleth map, I start from a black map as the one in the top, then one by one I manually add a grey value in five clusters, white for 0% and so on to +25% as the dark grey.
The US Census Bureau has a very specific data for Asians in US, but I use data also from the APIA and AAJC Asian organizations in US as well, the research phase takes me about a week, producing the graphics and coding it was about four days, and about an other week making edits and corroborating each small graphic and each word in the special feature. I must highlight that this graphic was not just a map, each state in the US has a detail of text and graphics so it was not ease to check, edit and revise.
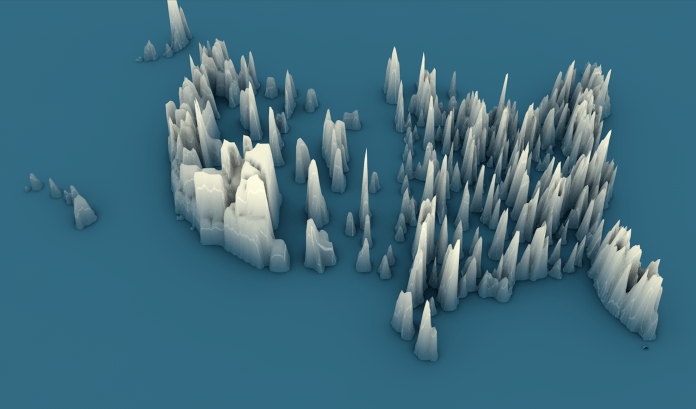
Early version of the country over view. As you may note, beyond color the elevation is different, my first data set was for total population instead of percent of the population
The map was generated with Cinema 4D, based on a grey scale county map, then styled with Illustrator and photoshop and coded with Brackets io trough SVG, Jquery, JS…
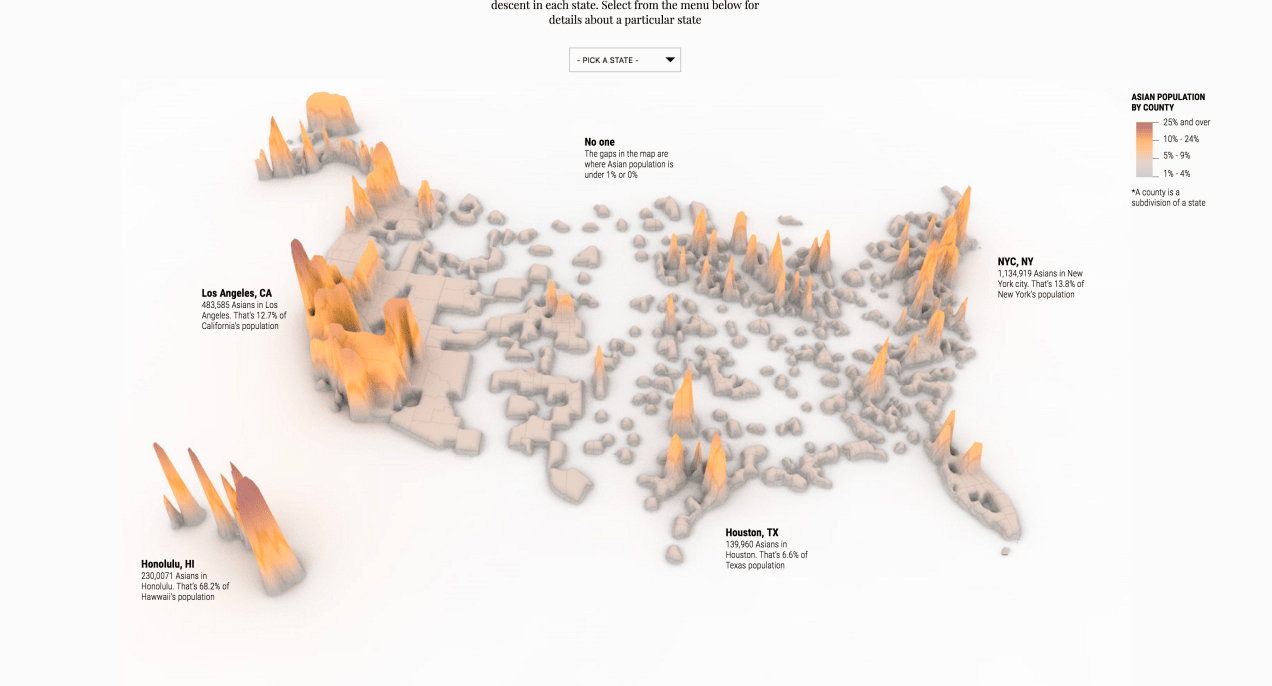
The color code is very important because the position of camera will change in perspective, so the color make easier to visually determinate the height of each area no matter the position. In the following image the camera position affect the way we perceive the height of the counties, just because the matter of point of view, but when color is on… well, see your self:
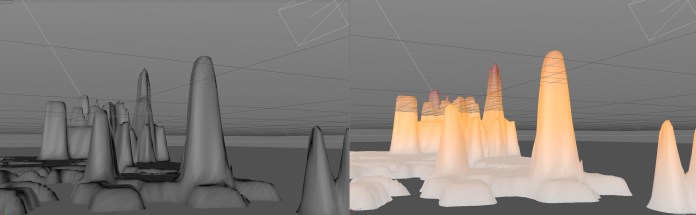
Brown means Asian population over 25% in the specific county (as well the height), I call that to perceive data in multidimensional ways, but keep it understandable
The position of cameras will change for each state, as for the videos and other sections using the specific portions of the map to tell different stories.
Following the 3D idea, the complementary graphics was also generated in C4D and the layout phase begin.
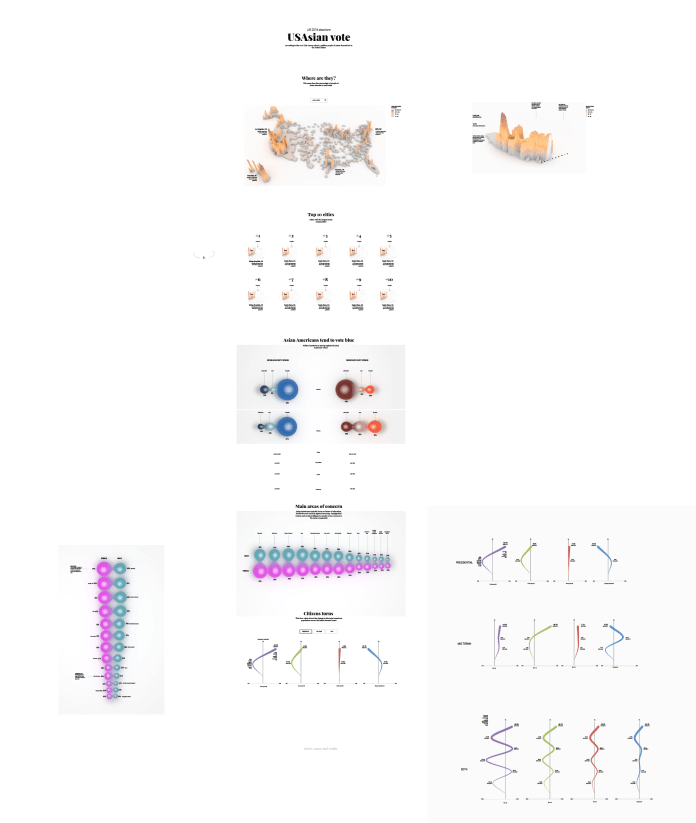
Some graphics display scroll-trigged video on desktop versions, then for mobile switch for static renders because IOS don’t allow autoplay videos or video out side the native player
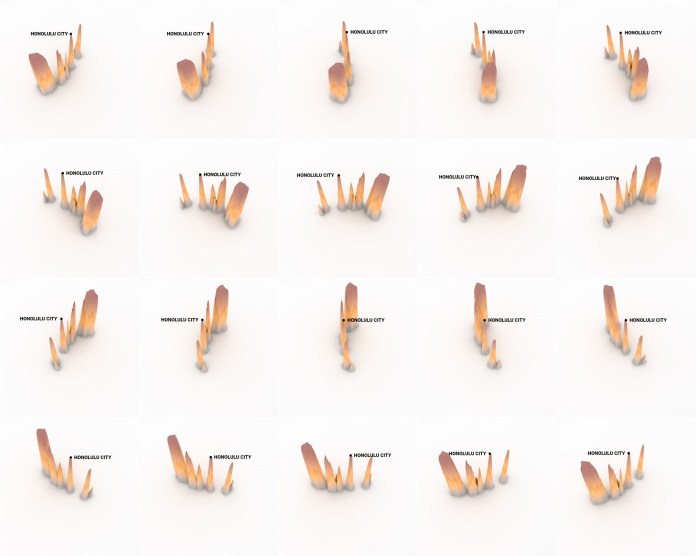
This is one of the city spinners, all of them uses an image like this, is positioned by the mouse drag final position and makes the 3d effect
Hope you as reader enjoy the project much as I enjoy to make it, please visit the special feature here http://multimedia.scmp.com/news/world/AsianAmerican/