

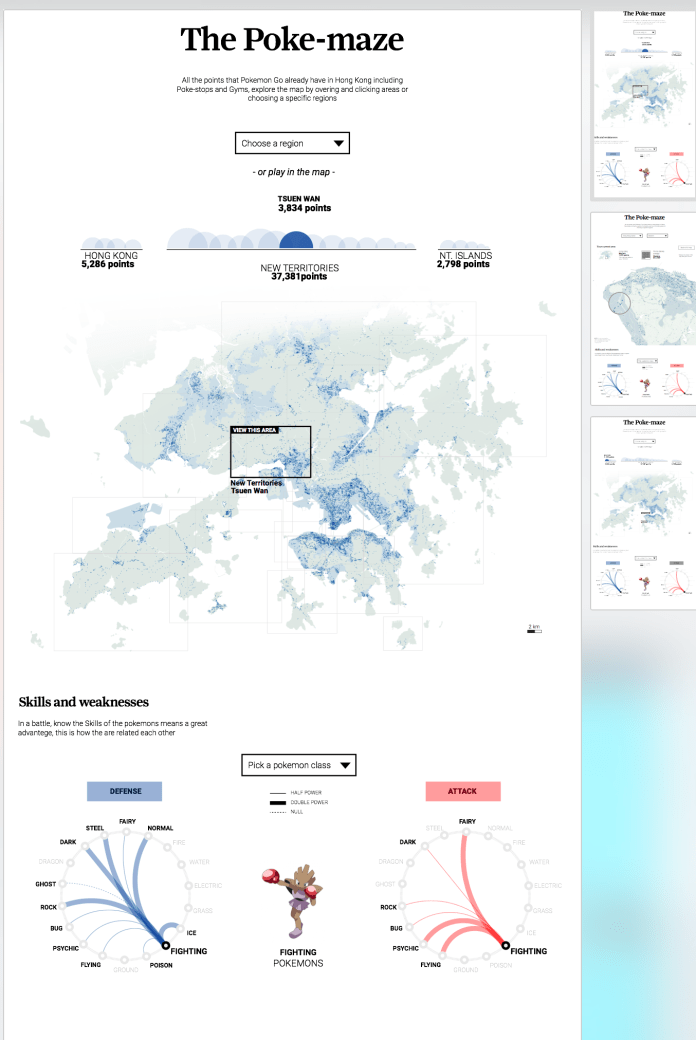
The Pokemon fever runs out the whole world, here in Hong Kong the people also was infected with the Pokemon global madness, so we in the SCMP graphics want’s to offer something different to our readers, and that was a detailed map of the Hong Kong Pokemon spots and a plus graphic about the Skills and weaknesses of each class of Pokemon.
The map was a hard work, to get all this data the folder of Pokemon project reach about 12 Gigabytes of my computer, but off course the final application on line is just about 500KB, I catch this information from an other game in which the creators was based to create the Pokemon virtual world, the whole process takes me 5 days including the new design and the development phase.
When I finish the data catch phase and clean it, the points shows a really nice pattern, following the urban areas but also reveals by him self the Islands shapes.

10% map sized of the original data. In the bottom right corner the most concentrated area of Pokemon spots, corresponds with the Hong Kong Island districts and the Kowloon territory crossing the bay area.
My first design was a purple points for the spots over a grey map, to give it a high contrast, but, then turns green and blue to keep it closer to the actual game interface. Usually I wrote my own text, but as you may know my english is not the best so, the layouts and the final product changes a bit on that also.
Illustrator layouts for Pokemon project. Version 2.2
The bottom section has a graphic about some characteristics of each class of Pokemon, the dropdown menu allows readers to switch the class and display different graphics, I have to say that I don’t like the Pokemon at all, even when I was younger, but I love to create data visualizations and offer to the people an other way of stories… visual stories; so Yes, I enjoy this project much as the Pokemon lovers has enjoy it also.
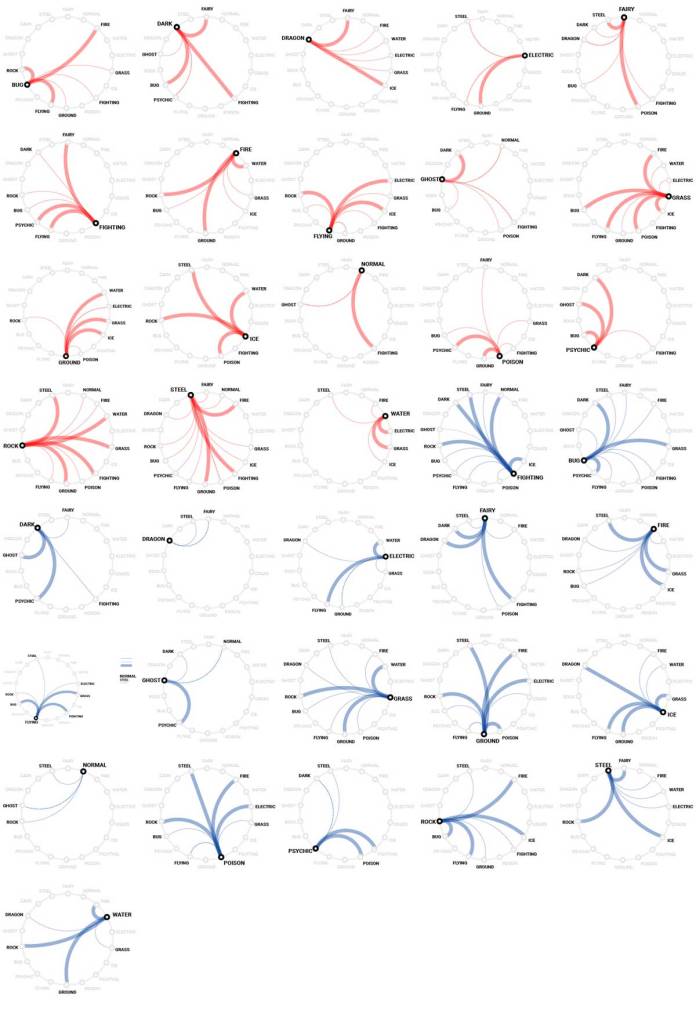
All the small graphics for Pokemon skills. Red for attack, blue for defence.
If you go inside a region of the map, the graphics will show you how dense are the spots in that area, how many spots are there and how big is in square km, ho! and also will allow you to zoom in just hovering the mouse in the map.
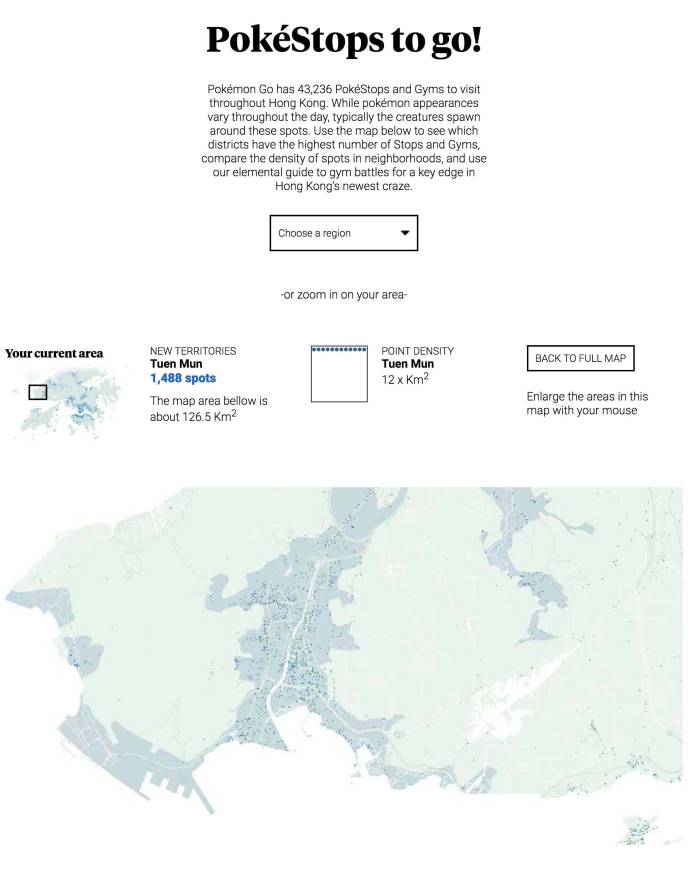
Area in detail, you can access by clicking areas in the main map, clicking the half circles of the top graphic, or choosing an specific region in the drop down menu.
You can find and enjoy the infographic in this link http://bit.ly/2aFU7W8
