Digital works

G20 meeting – Hangzhou –

Some days ago, the SCMP special package about the G20 meeting in Hangzhou, China was released. I must admit, I would have liked to have more time to intervene in the design, but I have a graphics queue waiting in other projects, so, I focused particularly on the graphics for this time.

hz_img3

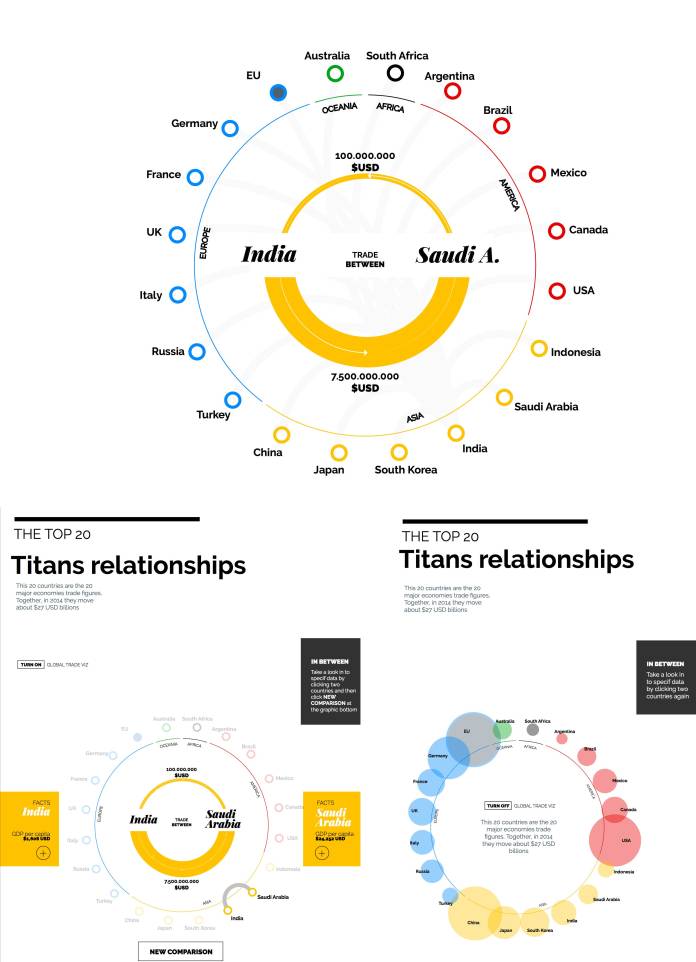
Illustrator layout for the first graphic.

There are 3 graphics, all them with small simply animations. Usually, I start analyzing the data on excel, or numbers in Mackintosh. Then I go to the paper, the scheme, aspect, interaction, variables and even animation is defined in the phase, thats the reason why this is the crucial part, and the harder one.

Next, is the vector time. I start the translation from paper to Illustrator, in this case, take the paper ideas to illustrator is just one day of work, but all the assets will be ready to the develop phase, is just a thing of order in the groups, layers and documents. That, because I take the illustrator files to generate the svg base for coding through javascript.

image4

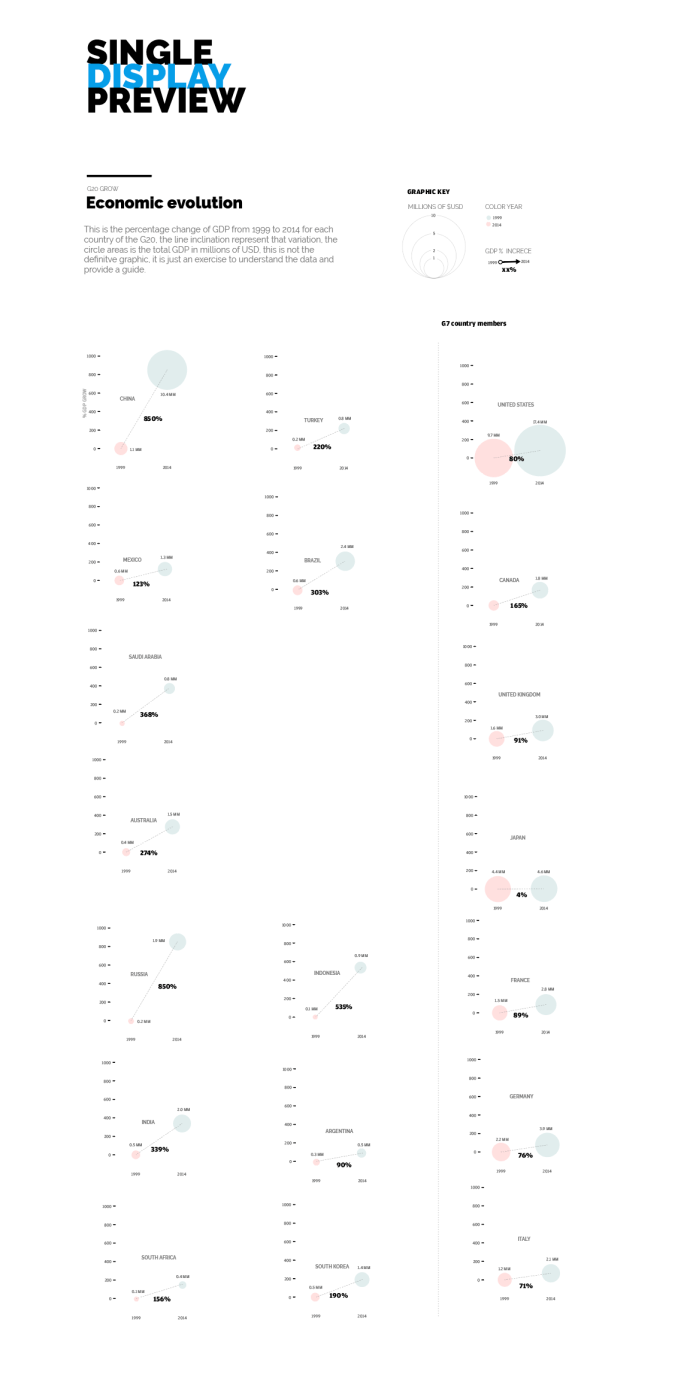
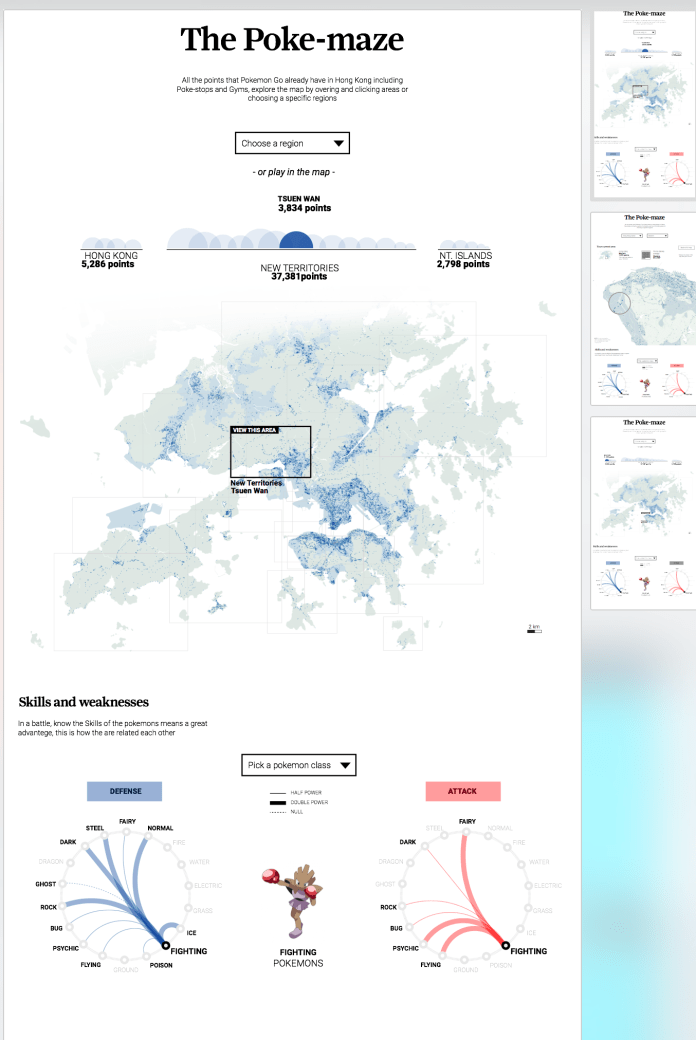
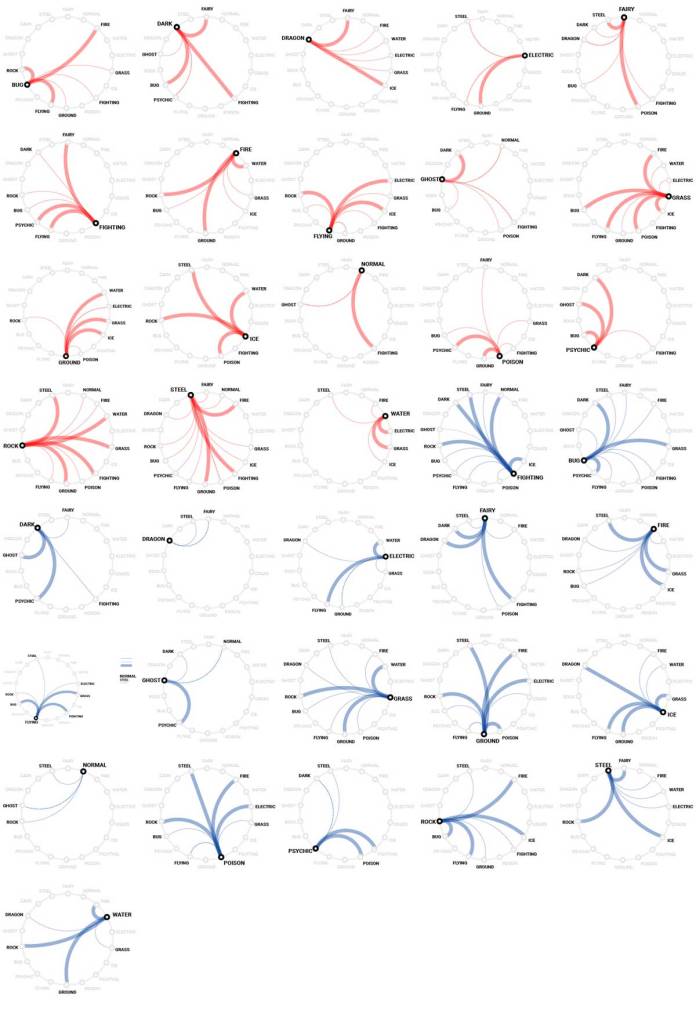
Initial scheme for the second graphic. This is a guide to take the idea. Some point forward the graphic change to an partial version with more interactive options by editors observations.

image5

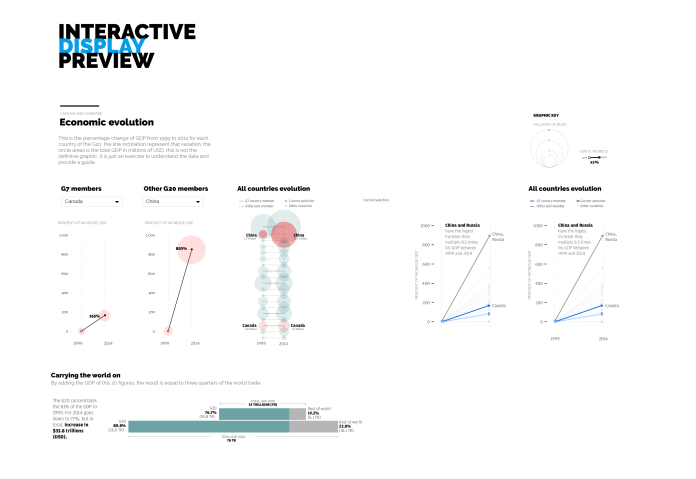
Here is the second proposal of the graphic 2, including the editors request.

The next step was the development phase.
I work with Brackets, an open source software to edit text code, it have a nice extensions to make the life simpler 🙂
If the asset don’t need to interact with js, I just call it as images, but if this asset needs to be transformed on color, position, size, opacity, content, shape… then a take the code from the svg file, which is very similar to an xml file. In this way I will be allowed to select parts of the svg and change it by coding instructions for the user interaction.

hz_img1

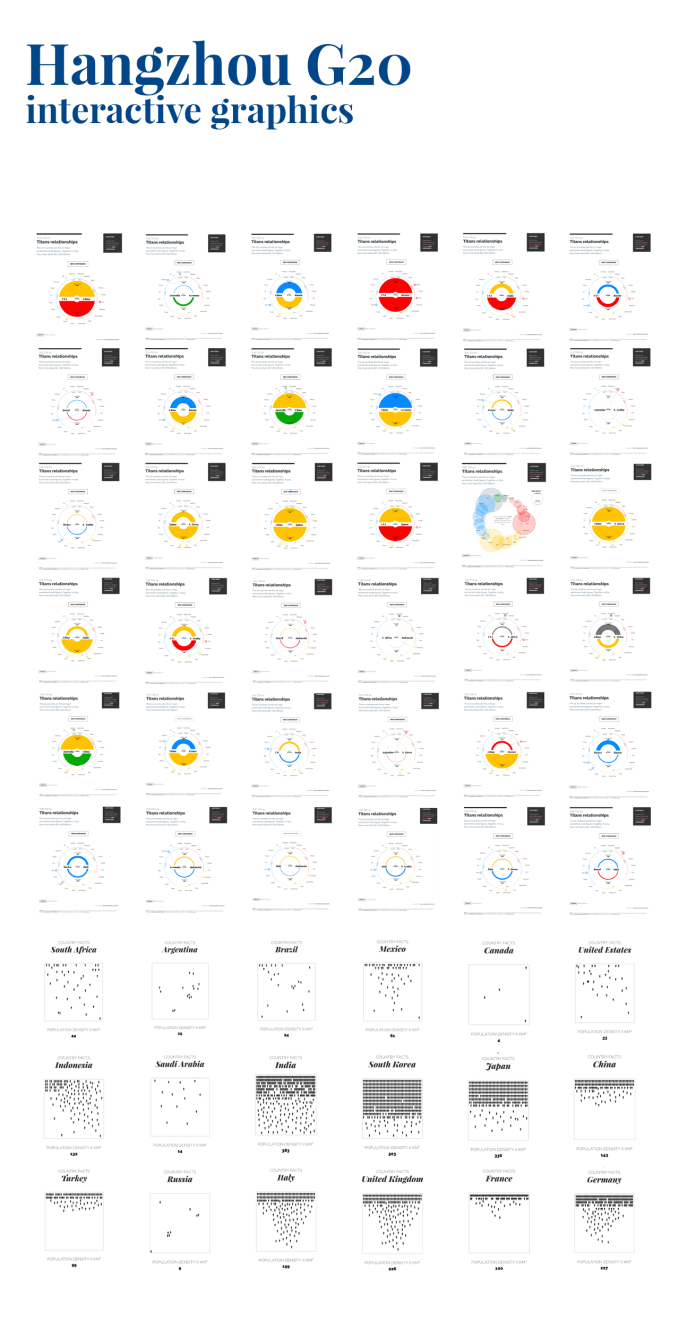
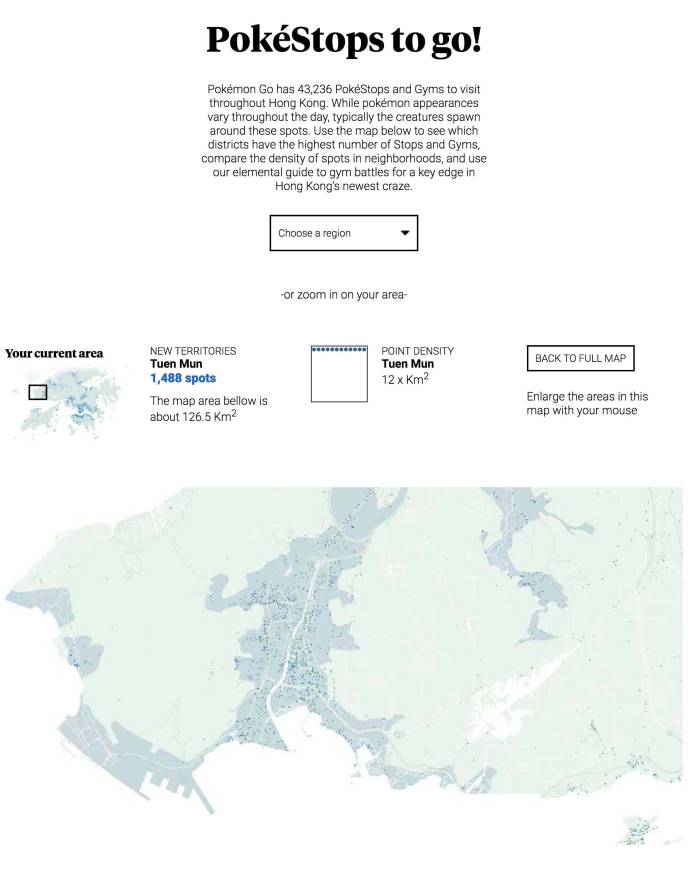
The first graphic has 191 posible configurations. At the bottom of this image, also is all the population density por all the G20 country members.

The process includes files such as .css .html .js .svg and some times depending on the functions or effects images, audio or video. Both versions (desktop and mobile) are working simultaneously, but some times different browser testing (cross browsing) and some queries remains to the end o the digital process.

Finally, when the digital product is ready, I have to make some smaller versions for the print, in this time, I take the graphics #1 and #3 to integrate in a very compact version, in total five graphics for different days of publications.


hz_img2

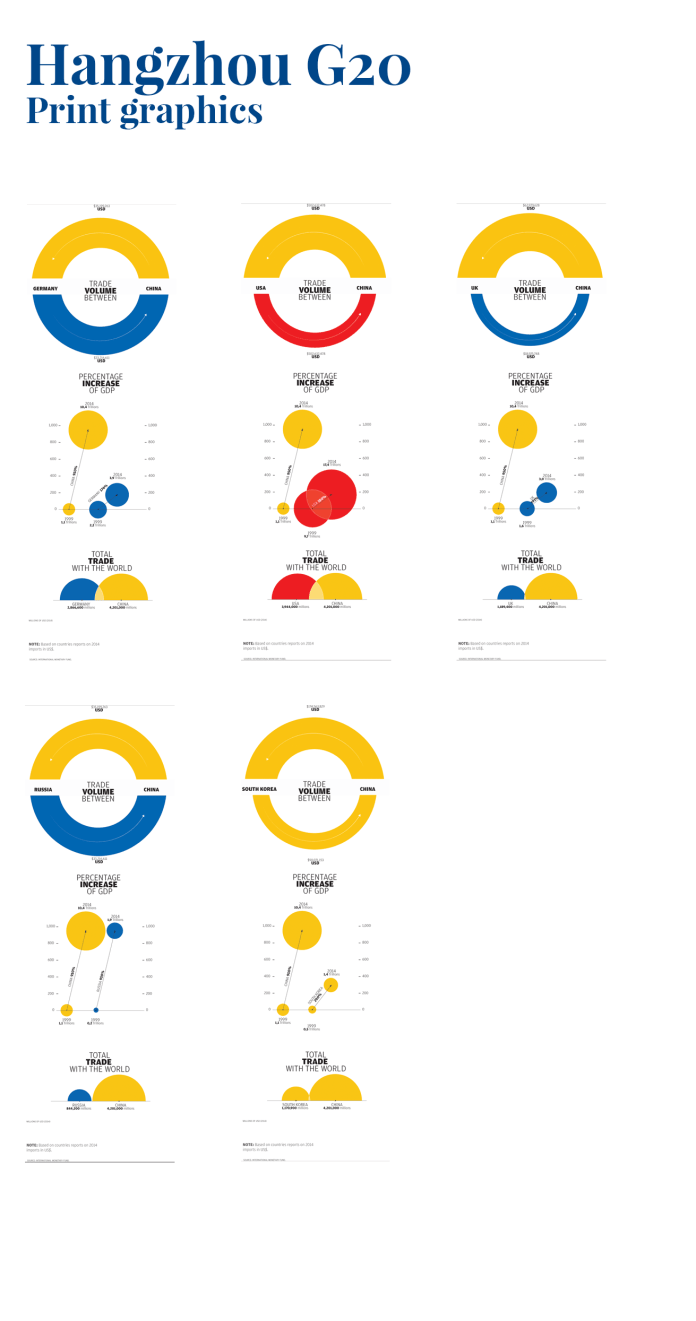
3 col graphics for 5 days of different publications

If you want to see the final product, you may find the interactive graphics here

Advertisement
Standard
Digital works

Pokemon invasion

The Pokemon fever runs out the whole world, here in Hong Kong the people also was infected with the Pokemon global madness, so we in the SCMP graphics want’s to offer something different to our readers, and that was a detailed map of the Hong Kong Pokemon spots and a plus graphic about the Skills and weaknesses of each class of Pokemon.


folder

The map was a hard work, to get all this data the folder of Pokemon project reach about 12 Gigabytes of my computer, but off course the final application on line is just about 500KB, I catch this information from an other game in which the creators was based to create the Pokemon virtual world, the whole process takes me 5 days including the new design and the development phase.

When I finish the data catch phase and clean it, the points shows a really nice pattern, following the urban areas but also reveals by him self the Islands shapes.

vector_10pc

10% map sized of the original data. In the bottom right corner the most concentrated area of Pokemon spots, corresponds with the Hong Kong Island districts and the Kowloon territory crossing the bay area.

My first design was a purple points for the spots over a grey map, to give it a high contrast, but, then turns green and blue to keep it closer to the actual game interface. Usually I wrote my own text, but as you may know my english is not the best so, the layouts and the final product changes a bit on that also.

layout_vrs2

Illustrator layouts for Pokemon project. Version 2.2

The bottom section has a graphic about some characteristics of each class of Pokemon, the dropdown menu allows readers to switch the class and display different graphics, I have to say that I don’t like the Pokemon at all, even when I was younger, but I love to create data visualizations and offer to the people an other way of stories… visual stories; so Yes, I enjoy this project much as the Pokemon lovers has enjoy it also.

pokemon_types

All the small graphics for Pokemon skills. Red for attack, blue for defence.

If you go inside a region of the map, the graphics will show you how dense are the spots in that area, how many spots are there and how big is in square km, ho! and also will allow you to zoom in just hovering the mouse in the map.

sitezoom

Area in detail, you can access by clicking areas in the main map, clicking the half circles of the top graphic, or choosing an specific region in the drop down menu.

You can find and enjoy the infographic in this link http://bit.ly/2aFU7W8

Standard