

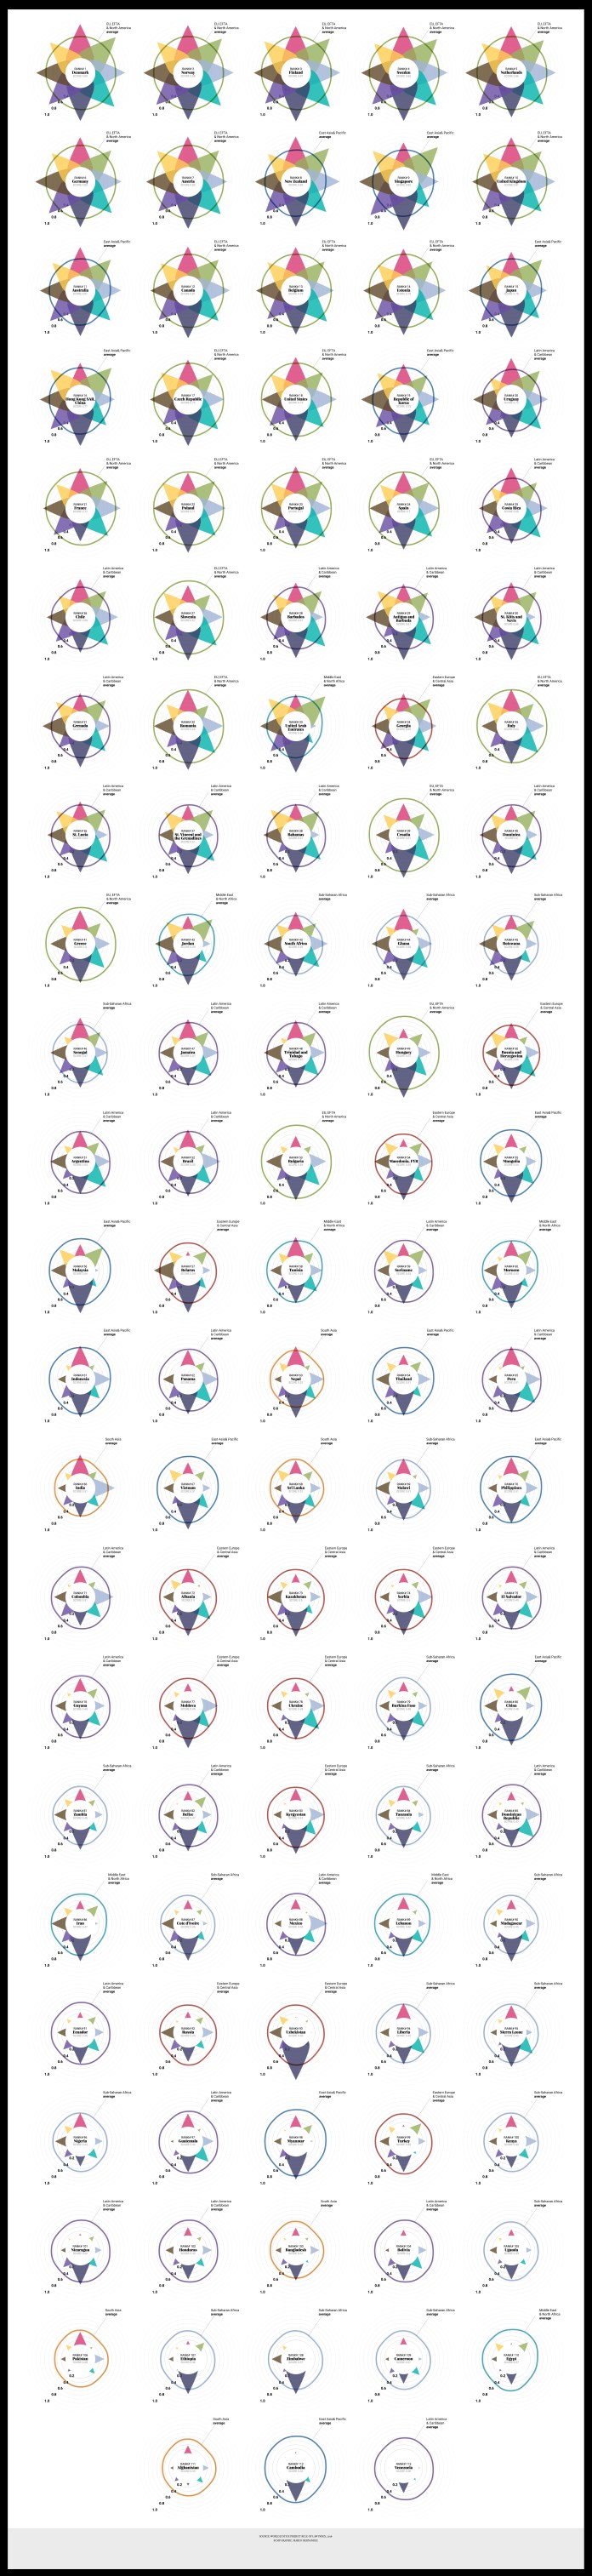
Rendered view of the World rank of rule of law 2016
This is a project based in data of the “World Justice Project Rule Of Law Index, 2016″ by the SCMP infographics team. Our goal was to show the information in a simply visual interactive tool, to give our readers also a perspective of Hong Kong and the world overview.
This was a very fast-build graphic, the idea was to show the world rank moving up and down from the last year to this year and also a visual report of each country/region.
Country report assets. The graphic is generated by json data thought js, this svg assets are rotated, scaled and positioned according the country data.
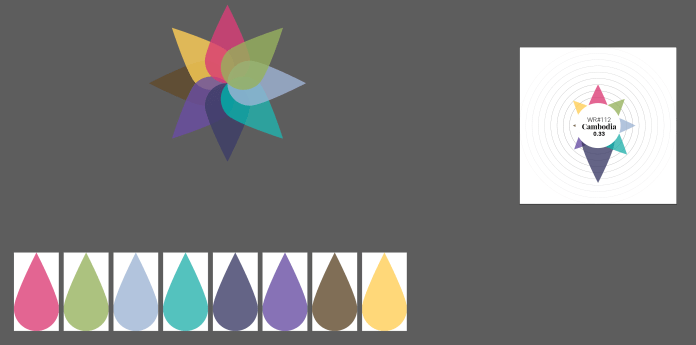
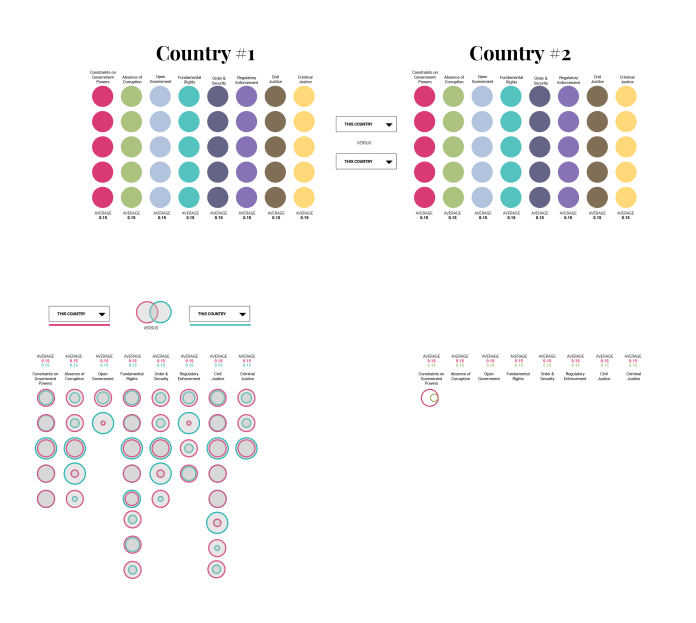
This graphic is a combination of css, svg, js, and json data. But only uses 8 files of a simply vector shape, so load very fast. The main idea was to give a comparison tool, to view the countries of interest side-by-side but also their position related to other countries in the region, that is the irregular shape, according to the scale, the average of each of the 7 regions is added via js to every country.
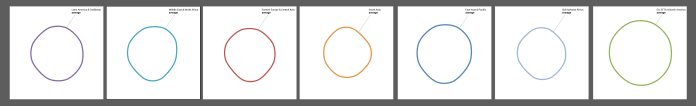
Seven region average index layers
The graphics evolved to an more effective visual representation, in my work is usual to create at less five previous concepts, from data reports like excel pivot tables to paper concepts and finally to vector graphics. The most effective way to show the data, some times come on the fifth or seventh iteration, but is the best way to create some informative and usable infographic.
Early concepts for the Rule of Law global index
Also, maybe thats the reason of some mistakes in the data, text or color codes in this images, the building up of this graphics always have the main ideas to guide the next versions, so it needs the text and visuals in more than simply Lorem Ipsum
First version of the index change (2015-2016)
Hope you enjoy the graphic story, please take a look in to the final version here: http://multimedia.scmp.com/news/world/article/rule-of-law/
