Digital works

Nerd facts about China’s Cities classification project

Here is some of the work progress behind the China Cities project, released last week at scmp.com the first thing was the idea on a quick draft:

screen-shot-2016-10-07-at-7-36-32-pm

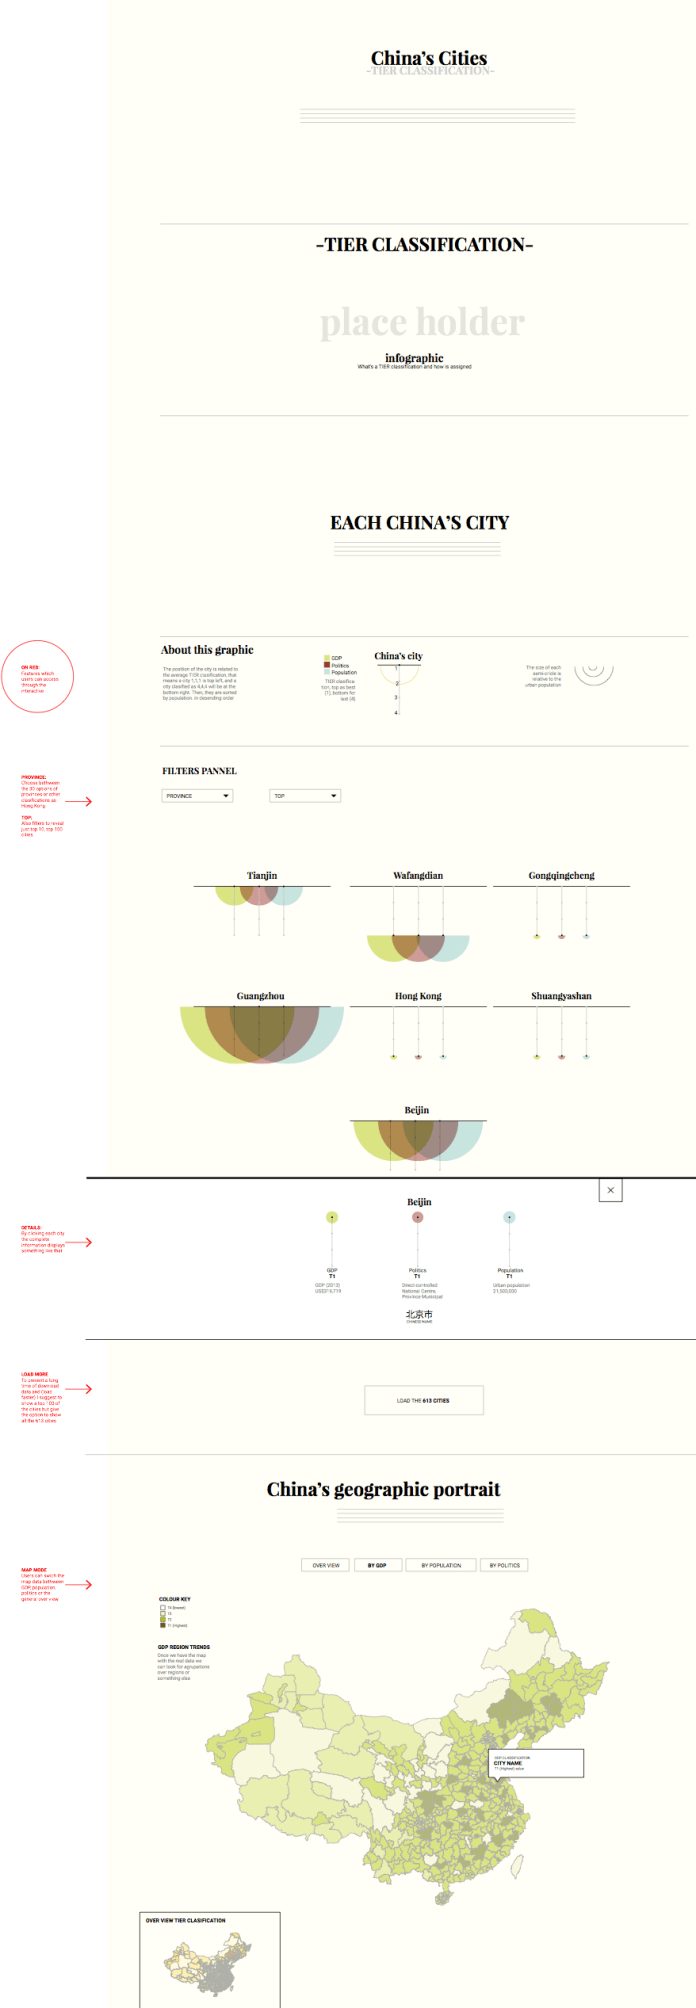
Concept layout for the special feature at scmp.com

This infographic about the China’s Cities classification was made must as a simply data graphic, it loads .json data for each city in to an html-svg graphic. All the 613 cities loads very fast, maybe the most heavy piece of this special feature is the China county map.

screen-shot-2016-10-07-at-7-38-59-pm

This is the look of each city behind the graphic

The map of China was no ease to make, on that level of detail seems is not available public any where so from a Chinese cartographer library I get a non labeled county map, well not in english at less, so for the next 3 days I spend my time looking for each county division corroborating and adding names to specific regions of this new vector map of China.

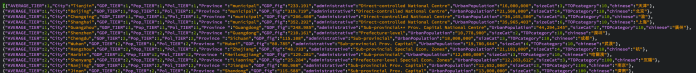
The map has 4 different configurations for each county, sounds like a few but actually that means 4x 613 different counties to check because China counties English map doesn’t exist here so two days more of checking added.
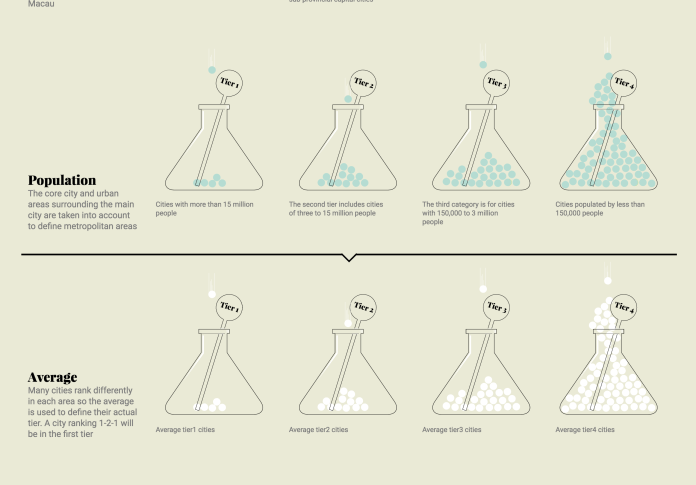
Then was time for fist section, the simplest graphics but the first ones that people will see, this graphics will show what’s a tier and how China’s cities are sorted in to:

Screen Shot 2016-10-07 at 7.32.12 PM.png

As a summary this project take a 7 days of my life hahahah, but it was funny take a look in to the final product here: http://multimedia.scmp.com/2016/cities/

Advertisement
Standard

Leave a Reply

Fill in your details below or click an icon to log in:

WordPress.com Logo

You are commenting using your WordPress.com account. Log Out /  Change )

Facebook photo

You are commenting using your Facebook account. Log Out /  Change )

Connecting to %s